Nearly two-thirds of both LGBTQ and non-LGBTQ adults under 50 in the United States say they hope to marry someday, according to Pew Research Center surveys conducted earlier this year.
Among LGBTQ adults under 50, 59% say they want to get married someday, which is just slightly under the 63% of non-LGBTQ adults who say they wish to get married someday. Regardless of identity, 12% say they do not want to get married, while 25% of non-LGBTQ adults and 28% of LGBTQ adults are not sure if they want to get married.
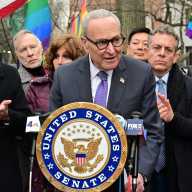
The survey’s results, released on Aug. 11, coincide with increased attention on the long-term stability of marriage equality in recent years. In 2022, then-President Joe Biden signed the Respect for Marriage Act into law, which requires states to recognize legally-performed marriages. Most recently, the notorious Kentucky county clerk Kim Davis, known for refusing to issue marriage licenses to queer couples, asked the Supreme Court to review its landmark 2015 ruling that extended same-sex marriage rights nationwide.
While Americans show similar aspirations for marriage overall, differences begin to appear when surveys are broken down by age or by whether individuals seek to have children. Among LGBTQ adults between the ages of 18 and 29, 67% want to get married someday — again, slightly under the 73% of non-LGBTQ adults in the same age range who answered the same way. The desire to get married, however, drops sharply with age, with 48% of LGBTQ adults between 30 and 49 years old expressing that they wish to get married someday. That number is nearly identical for non-LGBTQ adults (49%).
Among other areas, LGBTQ and non-LGBTQ individuals differ on the topic of whether they wish to have children. Among LGBTQ adults under 50, 33% wish to have children, compared to 47% of non-LGBTQ adults. Furthermore, 39% of LGBTQ adults say they do not want to have children and 28% say they are not sure, while 23% of non-LGBTQ adults do not plan to have kids and 29% are not sure.
Similar percentages of LGBTQ men (36%) and women (37%) say they want to have children someday, and the same share of LGBTQ men and women say they either do not want to have children (36%) or are not sure (28% for men and 27% for women). The chart notably failed to include non-binary individuals.
The more significant differences, though, are among non-LGBTQ adults: While 54% of non-LGBTQ men want to have children, only 39% of non-LGBTQ women want to have children. Moreover, 30% of non-LGBTQ women do not want to have kids, compared to just 18% of men. Similar percentages of non-LGBTQ men and women say they are not sure if they want children, with 28% of men and 30% of women answering that way.
Political affiliation appears to be a major indicator of whether people want to have children. While 66% of Republican men want children, that number falls to 43% for Democratic men. Among women 42% of Republicans and 38% of Democrats want to have kids.
A Pew Research Survey from 2013 found that 52% of all unmarried LGBTQ adults said they wanted to get married, while 33% said they were not sure and 15% said they did not want to get married. However, among LGBTQ adults overall, 60% of LGBTQ respondents said they were either married or wanted to get married.
Overall, American support for marriage equality has dipped slightly, but remains fairly steady at 68%, according to a Gallup poll released earlier this year. Support peaked in 2022 and 2023 at 71% before dipping to 69% in 2024 and 68% in 2025. The drop is overwhelmingly driven by Republican respondents, who went from a high of 55% support for marriage equality in 2022 to a dismal 41% in 2025.